


Cloud infrastructure and APIs are the backbone of modern business operations, essential for delivering smooth, uninterrupted customer experiences. Applications increasingly depend on APIs due to multiple integrations with third-party vendors, which makes API performance directly tied to customer satisfaction a slow or failing third-party API can degrade an otherwise healthy application without any code change on the application's own side.
Here's how Bajaj Tech.AI moved from traditional proactive polling to a real-time, open-source monitoring architecture on AWS EKS.
The most expensive way to monitor an API is often the most common one polling it constantly, whether or not anything has actually changed.
Why Doesn't Traditional API Polling Work Well at Scale?
One widely used approach to API monitoring is proactive polling. While helpful, this approach has real downsides: it polls APIs at set intervals, adding unnecessary load, increasing costs for external API calls, and failing to reflect the actual volume of API traffic you're paying to ask a question whether or not the answer has changed.
How Does Real-Time Monitoring Solve This?
Real-time API monitoring eliminates the need for constant polling, reducing the cost of monitoring external APIs while accurately tracking the actual number of hits per API. The application logs key metrics directly, and all data is stored in an OpenSearch domain's index monitoring driven by actual events rather than a fixed polling schedule.
What Does the Monitoring Architecture Actually Look Like?
Bajaj Tech.AI's team deployed and configured a suite of open-source monitoring tools and exporters onto AWS EKS. Prometheus was strategically configured to scrape data from all virtual machines running the monitoring agent, and to capture metrics from the exporter. To optimize cost, the exporter was configured to gather data specifically from tagged resources, ensuring efficient, cost-effective infrastructure monitoring rather than monitoring everything indiscriminately a deliberate design choice that kept monitoring overhead proportional to actual infrastructure value rather than growing linearly with every new resource added.
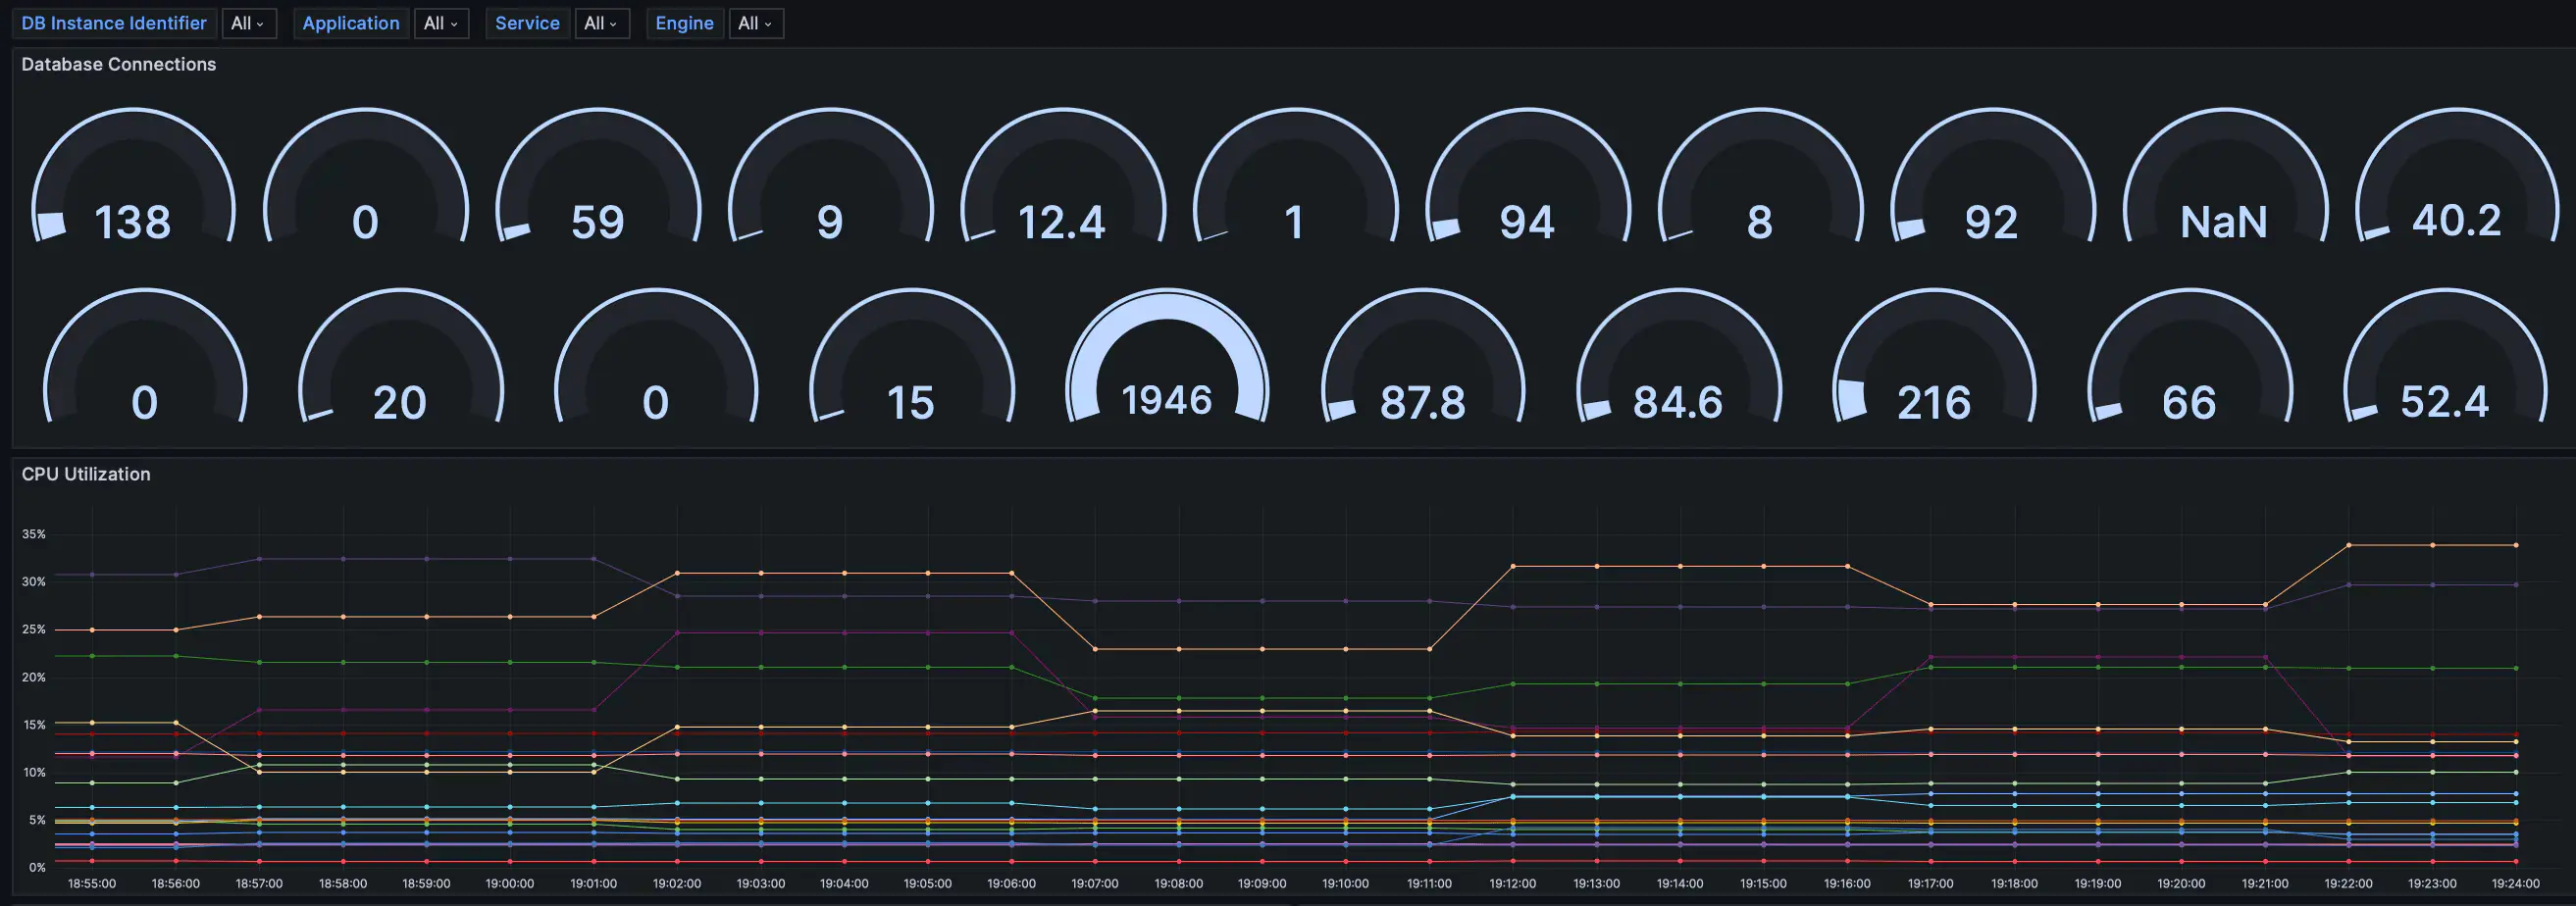
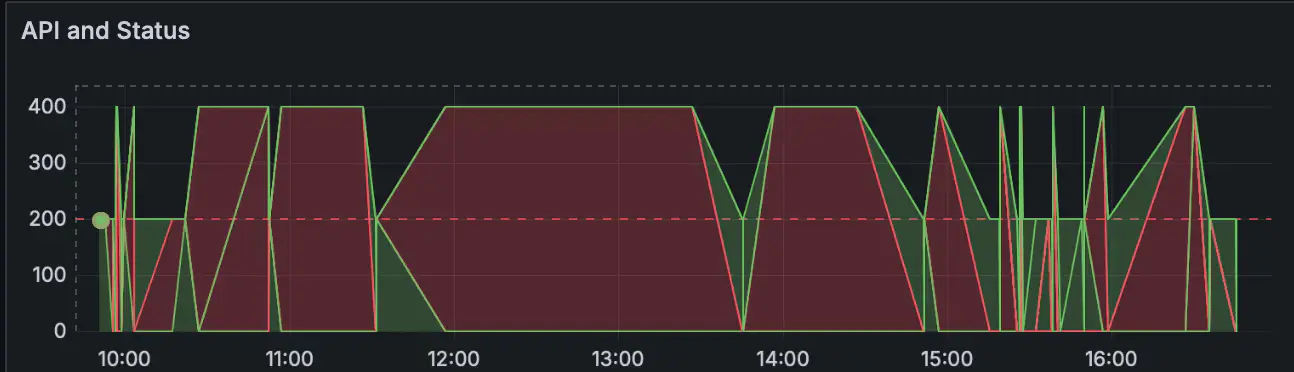
Real-time dashboards were configured to show key details about API performance number of requests, response times, errors. Using specialized data filters in Grafana made it easier to focus on the most relevant information, helping leaders make quick, informed decisions rather than sifting through raw metrics.
Tagging resources for the exporter to scope its data collection is a small detail with outsized cost impact it's the difference between monitoring everything by default and monitoring exactly what matters.
Database Monitoring:
API Status Code:
How Do You Alert on JSON Log Data When Alerting Tools Expect Numbers?
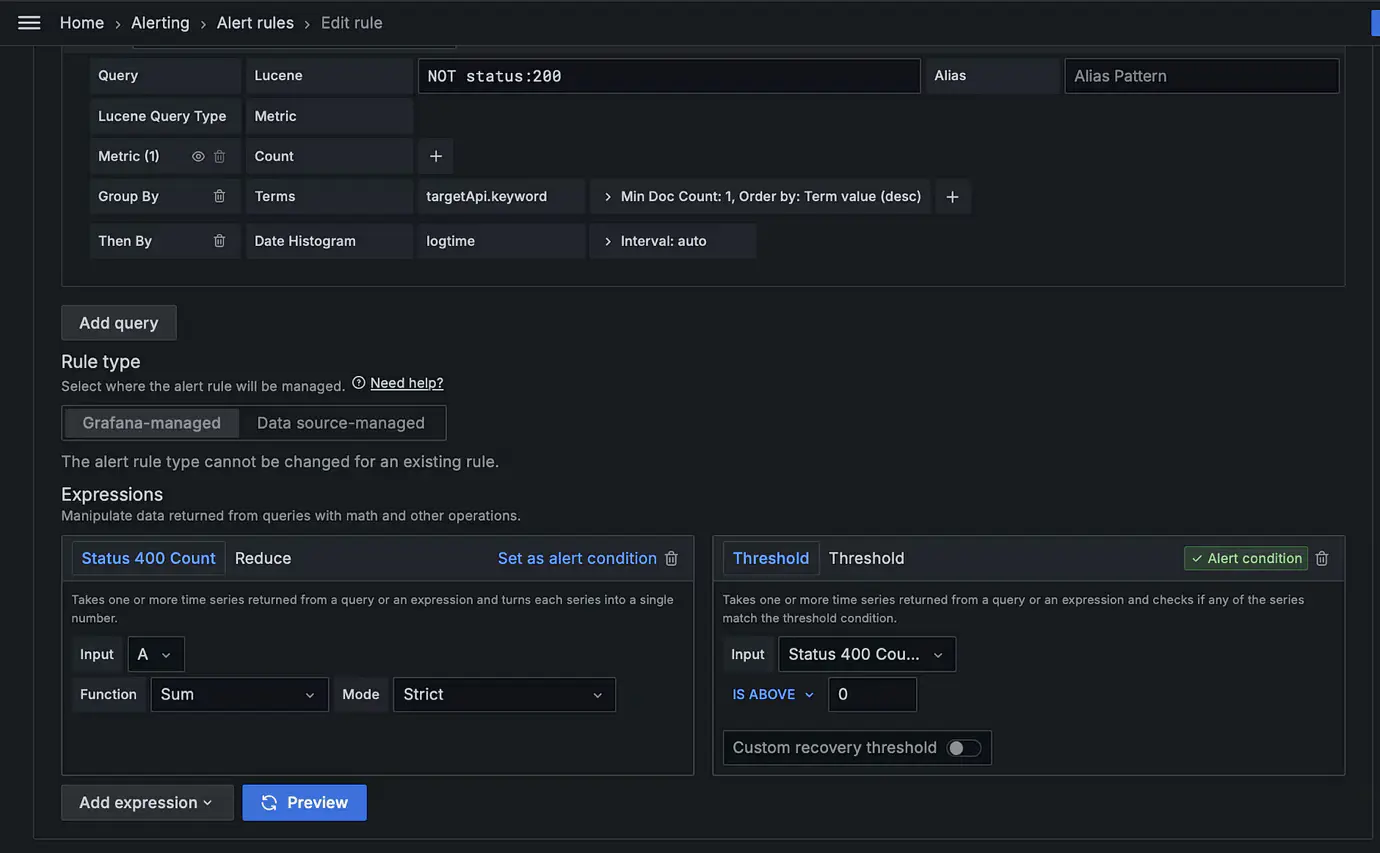
A major challenge was that Grafana alerts typically rely on numeric data, while the team was working with JSON log data. To solve this, a Lucene query was created that matched the alert conditions and organized the data by metric and timestamp transforming log data into a time series format that enabled precise alerts.
After setup, the alert system worked effectively, allowing the team to quickly identify and resolve issues including alerting on non-200 API status codes as they occurred, rather than discovering them after the fact.
Alert: Status not 200:
How Are Alerts Actually Routed to the Right People?
A custom Python service was built to manage infrastructure and API alerts. This service efficiently creates support tickets in the ITSM tool and sends real-time email and call notifications to the right stakeholders closing the loop between detection and actual human response, rather than leaving alerts sitting in a dashboard no one is actively watching.
Key Takeaways
- Event-driven, real-time API monitoring avoids the unnecessary cost and load that constant polling adds
- Tagging resources for targeted metric collection keeps monitoring costs proportional to what actually matters
- Converting JSON log data into time series format via Lucene queries lets standard numeric alerting tools work with non-numeric data
- Custom alert routing tickets plus real-time notifications is what turns detection into an actual response, not just a dashboard nobody watches
- This kind of monitoring infrastructure is a natural companion to the SRE practices and high availability architecture Bajaj Tech.AI has built elsewhere
Conclusion
This integrated monitoring and alerting solution gives real-time insight into API and infrastructure performance, helping detect and resolve issues quickly while improving efficiency and decision-making. Built entirely on open-source tools Prometheus, Grafana, OpenSearch deployed on AWS EKS, the architecture avoids vendor lock-in while still delivering enterprise-grade visibility. Ultimately, this kind of monitoring drives business continuity and growth by catching problems before they become customer-facing incidents.
Looking to build real-time, cost-efficient monitoring for your own infrastructure? Connect with our experts to explore the right approach for your organization.







Email: info@bajajtechai.com
Ph. No.: +91 9049001579 (Mon to Sat - 9 am to 6 pm IST)
